Product
Features
column
column
Add-ons
Integrate
Customers
By Industry
By Role
Success Stories
column
column
Pricing
Resources
Product Support
Education Resources
section
6 min read
A weekly sales report is a collection of predetermined sales data from your sales management app or operating system. This data is then analyzed to identify the progress of your sales team and, if necessary, used to make the appropriate data-driven adjustments.
But this is a horribly over-simplified explanation of the weekly sales report. The truth is, they can be dense, packed with all kinds of differing sales metrics and ultimately end up as one, big, confusing mess.
Field sales managers are then left scratching their heads left asking themselves, “am I really doing this right?”
In essence, by trying to manage too much, we end up managing too little. And the incessant drone of “data, data, data” surrounding sales management these days only makes the problem worse, with managers confusing these rallying cries as a need to add more and more to their weekly sales reports.
However, what is really needed is focus.
Field managers must decide what they want to measure and more importantly why before thinking about putting together a sales report.
This way we avoid the “analysis paralysis” and confusion that comes with giant data dumps, allowing us to see the wood, from the trees.
You may have worked on a sales floor where the walls appeared more like a kindergarten classroom than a sales office, such was their impressive array of colorful data charts and perfectly circumphransed pie charts.
You could find data available by region. Data segmented by product type. Data measuring sales activity and customer satisfaction levels. Data that analyzed the average length of calls, visits, sales cycles and even data breaking down the average travel time between meetings.
It was peacockery of sales data on the grandest of scales.
Yet underneath all this lavishness lay a serious problem.
You see, despite having more data available at our disposal than any time in sales management history we are still little more prepared to act upon it than our pen and paper forefathers were – there’s simply too much of it to ascertain where the real focus needs to be applied.
So before we hit “run” on our next weekly sales report we need to do a little reverse engineering of our sales process.
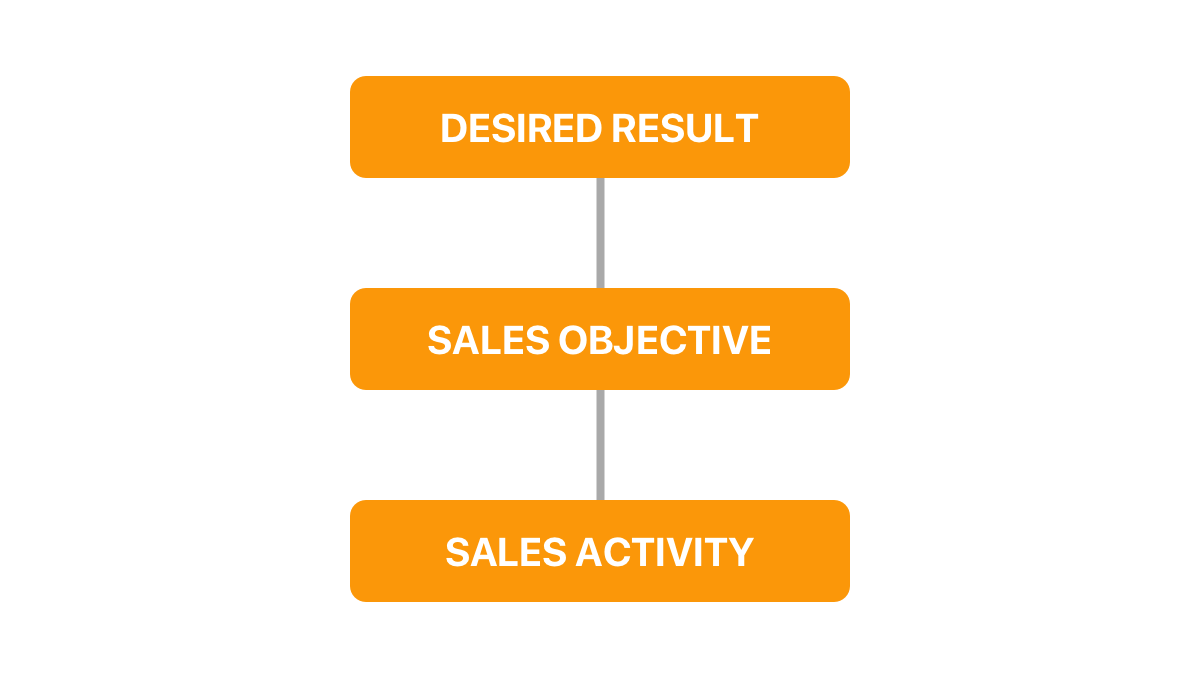
In order to apply this focus we have to start from the top. We have to first decide:
What is our ultimate goal, aim or desired business result
Because without an end result in mind, it’s impossible to:
Now if I asked you sales manager to sales manager, of all the metrics scattered across the office wall which would be one you would most like to affect change to, I guarantee that more than 9/10 of you would throw your hands in the air and go with:
Revenue.
That or some other business health related measurement such as profit margins or market share. Successfully increasing any of these would be a desired business result.
However, there are endless ways to achieve that. We could: increase closing rates, market coverage, focus on certain industries or new products. Perhaps even look at increasing customer retention rates and customer satisfaction levels. But this would only serve to further choke our weekly sales report of data again.
So we need to think hard and determine what would be the most influential objective to affect change to our key business result.
Unfortunately, it doesn’t end there. Asking your field sales team to “increase closing rates” or “improve customer retention” is akin to the CEO asking you to simply “increase sales…”
Again, there are endless possible ways to achieving that.
What’s missing is specificity. We must dive just one layer deeper to determine those sales activities that positively affect change to our elected objectives. These activities are what your field reps do on a day-to-day basis and as such, are the things that you can manage.

By choosing an interrelated chain of sales metrics it allows you, the field sales manager, to dial-out the noise. Your weekly sales report will become streamlined, digestible and focused pinpointing the specific activities that need to be improved.
Let’s look at a specific example:

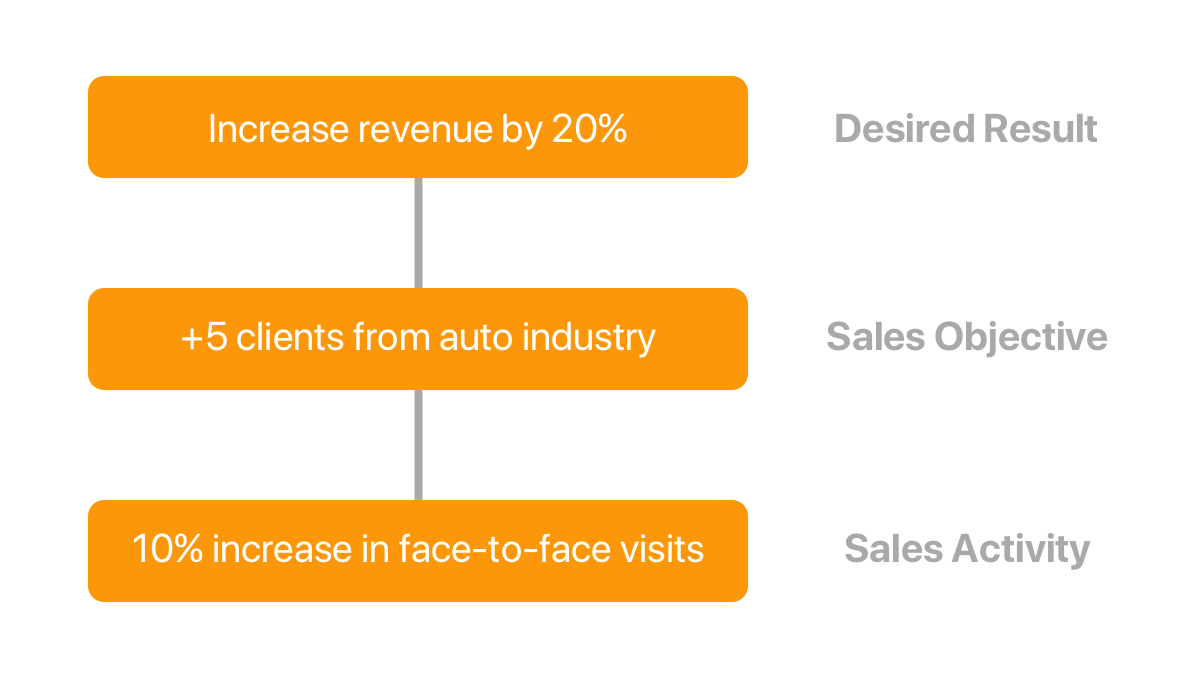
Imagine your desired business result was to increase overall company revenue by 20% over Q2 and Q3. We determined earlier that there are several factors that affect revenue growth, so which one do you choose?
As a result of some careful analysis by your marketing team an increase in product interest within the auto industry was detected, highlighting a previously unexplored vertical (the size and potential of which is huge).
Armed with that knowledge, you set a sales objective to obtain 5 new clients from this vertical. These 5 new clients obtained at the average deal value would be enough to see you hit your target of 20% in increased revenue.
However, remember we need to assign our field reps an activity that we can directly control or manipulate.
One way we can do that is to increase the number of visits made to prospects within the industry, a recurring increase of 10% every week throughout the quarter.
Now when we receive our weekly sales report it will focus only on these 3 metrics. No collated graphs on overall market share. No pie charts breaking down retention rates and definitely no average call figures – just the info you need to help your sales team’s towards achieving this one specific goal.
Increasing revenue by 20%.
Let’ look at another example:

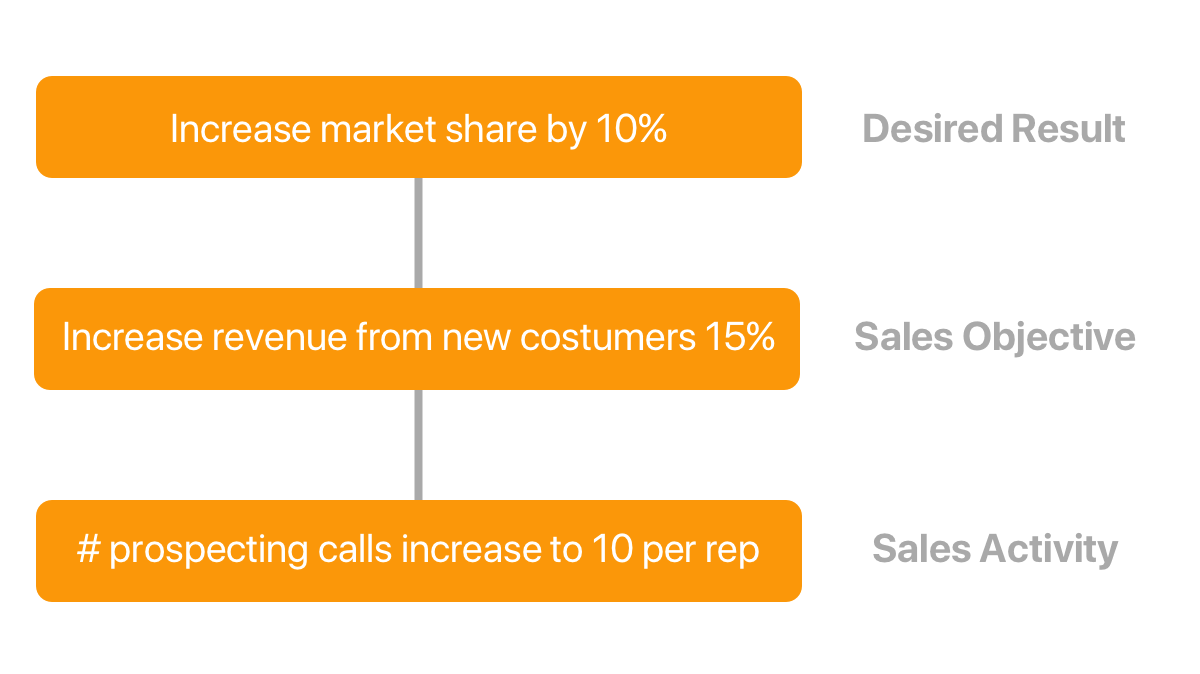
This time our goals is to increase market share by 10%.
Now there are two main objectives we could push for to make that happen. One is to increase the share of business negotiated with existing clients, pulling them away from our competitors either with new product releases or increasing our wallet allocation.
However, we determine that the more effective method of approaching this challenge is to target new customers. Our objective, therefore, is to increase revenue by 15% from new clients.
The only way to get in front of prospects is to get out there visit them in person, so we decide to set our sales team a goal of 10 face-to-face visits each month. Again, our weekly sales report will reflect our team’s progress towards achieving this objective.
If they are falling short of their sales activity goal then we can safely assume it puts our objective of increased revenue at risk and consequently, the end goal of desired increase in market share.
Remember, this system only works if your sales activities drive your objectives which in turn, drive your results. If any link in the chain is broken then the elected sales activity will have little effect on your over results.
Over a 2-3 year period, field sales manager’s targets can change dramatically:
The point is, all this change means that as field sales managers we have to be agile. Each shift in direction brings with it a set of new desired business results, sales objectives and activities. Our sales process and weekly sales reports must refocus to reflect these additional changes.
Many sales teams are guilty of using the same performance metrics (or worse, simply adding new ones to the existing process) despite the challenge or go-to market strategy changing. The weekly sales reports become inundated with irrelevant data and we undo all the hard work of keeping them clean and focused.
It’s not to say these sales reports are unimportant; its likely someone cares about them and needs to know, but is it that person you? Possibly? But you should seriously ask yourself that before adding yet another layer of complexity to your weekly sales report.
If in doubt, reassess your activity chain to find the most logical series of actions that leads to your desired business results.
The final point I want to touch upon is the importance of accurate, live data.
Most of the sales data collated in your weekly sales report will be culled from a mobile CRM or sales management system. You’ll be able to obtain Information pertaining to the number of sales visits made, customers called, deal transactions, values and average sales cycle length.
The issue here is that this data has to be entered manually; you are relying on your team to accurately and consistently update the system.
If they’re not, you’ve got a serious problem.
We use these reports to analyze the activity of our team. If they are falling short in certain areas it’s our job to provide additional assistance or coaching to get them back on track. If the data you’re reviewing isn’t accurate or entered in real time, then the decisions you make are going to reflect that inaccuracy and could actually negatively impact your performance.
For example, imagine you have a sales rep who typically enters their sales data on the second Friday of every month.
The last report you received showed some impressive figures; they were successfully closing deals and had an important meeting lined up with a high-value prospect. Closing out that final prospect is critical if you are to achieve your sales forecast.
However, unbeknown to you that final deal had taken an unexpected turn for the worse, with a late decision being made to side with a competitor. Not unheard of, these things happen in sales…but seeing as you didn’t have visibility over these changes you weren’t able to step in and help nor adjust the forecast and strategy to account for this loss.
So how to we stop this from happening again?
One way is to employ a frictionless system with high user adoption rates. The easier you can make the sales platform to use, the more likelier your team are to use it. Even better if it’s a system with mobile capabilities; field reps spend so much time out on the road that coming back to the head office to update a CRM is unrealistic and impractical.
Empowering them with a mobile system allows them to update sales opportunities in real time and provides you more accurate data with which to work with.
To conclude, it’s our jobs as field sales managers to coach our team and push them towards achieving our business objectives. The weekly sales report is the window in which we peer through to judge their level of performance and, if that window is blocked by overflowing streams of irrelevant or worse, expired or inaccurate data then it makes our determinations all that more difficult to make.